Abstract
Objective : To combine two indicators, asprosin and lipid accumulation product (LAP), to assess their predictive value for non-alcoholic fatty liver disease (NAFLD) and to provide a more convenient and accurate option for mass screening of the NAFLD population.
Methods : Data were collected from 1249 adult subjects who underwent physical examination, LAP was calculated and serum asprosin was measured. Statistical analyses were performed and ROC curves were constructed to assess the predictive value of asprosin, LAP and their combination for NAFLD.
Results : Asprosin and LAP levels were significantly higher in the NAFLD group than in the non-NAFLD group (P < 0.001), and asprosin and LAP were independent risk factors for the development of NAFLD (P < 0.05). The combination of asprosin and LAP had the highest predictive efficacy for NAFLD, and the AUCs were 0.841, 0.821 and 0.871 in the total, male and female populations, respectively.
Conclusion : Asprosin and LAP are both good predictors of NAFLD, and their combined performance is better than either indicator alone, and better in women than in men. The combination of asprosin and LAP may be an ideal marker for NAFLD screening and individualised monitoring and management.
Keywords
INTRODUCTION
Non-alcoholic fatty liver disease (NAFLD) is a clinical condition characterised by the abnormal accumulation of lipids in hepatocytes [1]. If left untreated, it can progress to end-stage liver disease such as non-alcoholic steatohepatitis (NASH), cirrhosis and even hepatocellular carcinoma and liver failure [2]. The global prevalence of NAFLD is estimated to be 25%, affecting approximately 173-310 million people in China, and the disease burden of NAFLD has surpassed that of other chronic liver diseases and is a major public health challenge worldwide [3]. Early and timely diagnosis and intervention of NAFLD is crucial, as early NAFLD is reversible [1]. There is an urgent need to find simple, effective and inexpensive indicators for early mass screening.
Asprosin, a novel adipokine discovered in 2016, is secreted by white adipose tissue and plays an important role in maintaining energy homeostasis, inflammation and immune response [4]. Several recent studies have confirmed the integral role of asprosin in the pathophysiology of various metabolic diseases such as NAFLD, obesity, metabolic syndrome, diabetes mellitus, polycystic ovary syndrome and cardiovascular disease [5-10]. A previous study by our team also found a strong association between asprosin and NAFLD [11]. It has been suggested that asprosin expression is increased in the serum of NAFLD patients and that asprosin may be a valuable biomarker for the diagnosis of NAFLD [8].
The lipid accumulation product (LAP) was originally proposed by Kahn as an indicator of lipid excess [12]. Recent studies have shown that LAP is a powerful tool for the identification of NAFLD. A large cross-sectional study of 40,459 Chinese individuals confirmed that LAP was highly associated with the incidence and severity of NAFLD and was a reliable predictor of NAFLD risk in Chinese adults [13]. A meta-analysis also showed that LAP is a reliable marker for screening for NAFLD [14].
However, there are currently few studies using the combined indicators to screen for NAFLD. Based on the above theory, this study combined two indicators, Asprosin and LAP, to evaluate their predictive value for NAFLD, providing a more convenient and accurate option for early mass screening of the NAFLD population, which may aid in the early screening and subsequent management of the potential NAFLD population.
MATERIALS AND METHODS
Study Population
This study retrospectively analysed data from 1,249 adult subjects who underwent health examinations at the Physical Examination Centre of Hebei Provincial People’s Hospital during 2022.01-2023.01. Inclusion criteria: (1) age ≥18 years; (2) complete data. Exclusion criteria: (1) pregnant or lactating women; (2) men drinking ≥140 g/week or women drinking ≥70 g/week; (3) people with viral hepatitis, autoimmune liver disease and other chronic liver diseases; (4) people with chronic kidney disease, severe cardiovascular disease, haematological disease and malignant neoplasm; and (5) people who had used drugs affecting hepatic lipid metabolism within six months. The study was approved by the Ethics Committee of Hebei Provincial People’s Hospital and conducted according to the tenets of the Declaration of Helsinki. Informed consent was not required as all data in the study were retrospective and did not include personal and identifiable information about the subjects.
Data Collection and Measurement
In this study, information on the subjects’ lifestyle and medical history was collected using a standardised selfadministered questionnaire. Serum asprosin was measured using an enzyme-linked immunosorbent assay kit (ELAAB Science Inc), and basic information, general physical examination, and laboratory tests of the subjects were obtained from the electronic database of the medical examination centre. Basic information included sex and age; general physical examination included height, weight, and waist circumference (WC); and laboratory tests included triglycerides (TG), total cholesterol (TC), low-density lipoprotein cholesterol (LDL-C), high-density lipoprotein cholesterol (HDL-C), and fasting plasma glucose (FPG). BMI and LAP were calculated from the above indicators using the following formulae:
BMI = Weight (kg)/Height2 (m2)
LAP (male) = TG (mmol/L) × [WC (cm) - 65].
LAP (female) = TG (mmol/L) × [WC (cm) - 58].
Abdominal Ultrasound
Abdominal ultrasound was performed by an experienced sonographer using an ultrasound machine equipped with a curved array transducer probe (4-8 MHz) to assess fatty liver based on four dimensions: liver brightness, liver and kidney echo contrast, vascular blurring, and deep attenuation [15].
Statistical Analysis
The statistical analysis was conducted using SPSS 21.0 software. For normally distributed measurements, the data were expressed as the mean ± standard deviation (SD) and a t-test was employed to compare the two groups. For non-normally distributed measurements, the data were expressed as the median (P25, P75) and a Mann-Whitney Utest was used to compare the groups. Count data were expressed as numbers or percentages and an χ2 test was used to compare the groups. Asprosin and LAP were grouped into quartiles, and logistic regression analysis was used to calculate the OR and 95% CI of the risk of NAFLD in each quartile group of asprosin and LAP. The predictive value of the various indicators of NAFLD was analysed using the receiver operating characteristic (ROC) curve, and P < 0.05 was considered statistically significant.
RESULTS
Comparison of Baseline Data Between the Two Groups
Based on the results of abdominal ultrasonography, 1249 subjects were divided into the non-NAFLD group (n = 611) and the NAFLD group (n = 638).The proportion of males in the NAFLD group was significantly higher than that in the non-NAFLD group (P < 0.001); the levels of TC and LDL-C in the NAFLD group were higher than those in the non-NAFLD group (P < 0.05); the levels of BMI, WC , TG, FPG , asprosin, and LAP levels in the NAFLD group were significantly higher than those in the non-NAFLD group (P < 0.001), and the levels of HDL-C were significantly lower than those in the non NAFLD group (P < 0.001) (Table 1).
Table 1: Comparative analysis of baseline data between non-NAFLD and NAFLD groups
|
non-NAFLD (n= 611) |
NAFLD (n= 638) |
Statistical value |
P value |
|
|
Gender, n (%) |
||||
|
Males |
389(63.70%) |
531(83.20%) |
61.56 |
<0.001 |
|
Females |
222(36.30%) |
107(16.80%) |
||
|
Age (years) |
52(40, 59) |
51(40, 58) |
-1.29 |
0.198 |
|
BMI (kg/m2) |
24.56(22.79, 26.40) |
27.46(25.78, 29.41) |
-17.40 |
<0.001 |
|
WC (cm) |
88(82, 94) |
96(91, 103) |
-16.29 |
<0.001 |
|
TG (mmol/L) |
1.22(0.89, 1.68) |
1.86(1.42, 2.76) |
-14.82 |
<0.001 |
|
TC (mmol/L) |
5.22±1.01 |
5.34±1.04 |
-2.15 |
0.032 |
|
LDL-C(mmol/L) |
3.27±0.75 |
3.39±0.72 |
-3.06 |
0.002 |
|
HDL-C(mmol/L) |
1.32(1.16, 1.54) |
1.19(1.05, 1.35) |
-9.67 |
<0.001 |
|
FPG (mmol/L) |
5.35(5.02, 5.79) |
5.79(5.31, 6.63) |
-10.43 |
<0.001 |
|
Asprosin(ng/mL) |
20.61(14.66, 27.91) |
32.35(24.34, 40.34) |
-17.18 |
<0.001 |
|
LAP |
30.80(19.88, 44.80) |
61.62(42.39, 97.09) |
-18.31 |
<0.001 |
Multifactorial Logistic Regression Analysis of the Risk of Developing Nafld
Asprosin and LAP were divided into four subgroups at the quartile level as Q1, Q2, Q3 and Q4 groups, respectively. The covariates of gender, age, BMI, WC, TG, TC, LDL-C, HDLC, FPG, asprosin, and LAP were included in the analysis with the presence or absence of NAFLD as the dependent variable, and the results showed that BMI, TG, FPG, asprosin, and LAP were the independent risk factors for the occurrence of NAFLD (P < 0.05). After correction for each risk factor, the risk of NAFLD prevalence in the Q2, Q3 and Q4 asprosin groups was 3.841, 4.203 and 9.132 times higher, respectively, than in the Q1 asprosin group (P < 0.001, P < 0.001, P < 0.001). The risk of NAFLD prevalence in the Q2, Q3and Q4 LAP groups was 1.969, 2.682 and 4.097 times higher, respectively, than in the Q1 LAP group (P = 0.005, P = 0.020, P < 0.001) (Table 2).
Table 2: Multifactorial logistic regression analysis of NAFLD
|
B |
SE |
Wald χ2 |
OR |
95% CI |
P value |
|
|
Gender |
0.189 |
0.226 |
0.700 |
1.209 |
0.775~1.884 |
0.403 |
|
Age |
-0.011 |
0.007 |
2.540 |
0.989 |
0.975~1.003 |
0.111 |
|
BMI |
0.168 |
0.045 |
13.868 |
1.183 |
1.083~1.292 |
<0.001 |
|
WC |
0.014 |
0.018 |
0.619 |
1.014 |
0.979~1.051 |
0.431 |
|
TG |
0.234 |
0.117 |
3.988 |
1.264 |
1.004~1.590 |
0.046 |
|
TC |
-0.183 |
0.348 |
0.275 |
0.833 |
0.421~1.649 |
0.600 |
|
LDL-C |
0.269 |
0.434 |
0.382 |
1.308 |
0.558~3.065 |
0.536 |
|
HDL-C |
-0.466 |
0.447 |
1.088 |
0.627 |
0.261~1.507 |
0.297 |
|
FPG |
0.254 |
0.061 |
17.425 |
1.289 |
1.144~1.452 |
<0.001 |
|
Asprosin |
||||||
|
Q1 |
- |
- |
- |
1 |
- |
- |
|
Q2 |
1.346 |
0.218 |
38.145 |
3.841 |
2.506~5.887 |
<0.001 |
|
Q3 |
1.436 |
0.218 |
43.549 |
4.203 |
2.744~6.439 |
<0.001 |
|
Q4 |
2.212 |
0.249 |
78.943 |
9.132 |
5.606~14.874 |
<0.001 |
|
LAP |
||||||
|
Q1 |
- |
- |
- |
1 |
- |
- |
|
Q2 |
0.677 |
0.243 |
7.788 |
1.969 |
1.223~3.168 |
0.005 |
|
Q3 |
0.987 |
0.425 |
5.391 |
2.682 |
1.166~6.169 |
0.020 |
|
Q4 |
1.410 |
0.291 |
23.561 |
4.097 |
2.318~7.240 |
<0.001 |
Roc Curves of Asprosin, Lap and Their Combi nation for Predicting the Risk of Developing Nafld
The ROC curves of asprosin, LAP and their combination for predicting the risk of NAFLD were plotted for the total population, different sexes, respectively (Figure 1).
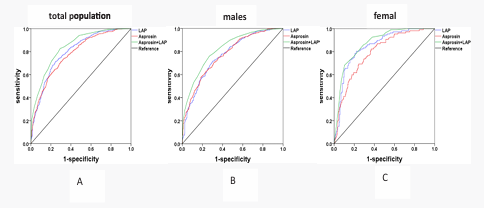
Figure 1: ROC curves for predicting the risk of developing NAFLD
The results showed that the AUCs of asprosin and LAP for predict ing NAFLD in the total population were 0.781 and 0.799, with optimal cut-offs of 26.185 ng/ml and 44.975, respecing NAFLD was 0.841 (Table 3).
Table 3: ROC curve of Asprosin and LAP prediction of NAFLD risk in total population
|
AUC |
95% CI |
Sensitivity (%) |
Specificity (%) |
Maximum Jordon index |
Cut-of value |
|
|
Asprosin |
0.781 |
0.756~0.806 |
70.8 |
70.5 |
0.413 |
26.185 |
|
LAP |
0.799 |
0.775~0.824 |
71.5 |
75.5 |
0.470 |
44.975 |
|
Asprosin+LAP |
0.841 |
0.819~0.862 |
82.8 |
70.7 |
0.535 |
- |
In the male population, the AUCs of asprosin and LAP for the prediction of NAFLD were 0.771 and 0.768, respectively, and the optimal cut-offs were 29.110 ng/ml and 44.900, respectively, and the AUC for thecombined prediction of NAFLD was 0.821 (Table 4).
Table 4: ROC curve of Asprosin and LAP prediction of NAFLD risk in males
|
AUC |
95% CI |
Sensitivity (%) |
Specificity (%) |
Maximum Jordon index |
Cut-of value |
|
|
Asprosin |
0.771 |
0.741~0.801 |
62.5 |
76.9 |
0.394 |
29.110 |
|
LAP |
0.768 |
0.737~0.799 |
71.8 |
69.7 |
0.415 |
44.900 |
|
Asprosin+LAP |
0.821 |
0.795~0.848 |
76.1 |
73.0 |
0.491 |
- |
In the female population, the AUCs of asprosin and LAP for predicting NAFLD were 0.791 and 0.845, respectively, and the optimal cut-offs were 22.420 ng/ml and 37.665, respectively, and the AUC of the combination of both for predicting NAFLD was 0.871 (Table 5).
Table 5: ROC curve of Asprosin and LAP prediction of NAFLD risk in females
|
AUC |
95% CI |
Sensitivity (%) |
Specificity (%) |
Maximum Jordon index |
Cut-of value |
|
|
Asprosin |
0.791 |
0.741~0.841 |
82.2 |
63.1 |
0.453 |
22.420 |
|
LAP |
0.845 |
0.801~0.889 |
80.4 |
77.9 |
0.583 |
37.665 |
|
Asprosin+LAP |
0.871 |
0.832~0.909 |
68.2 |
89.6 |
0.578 |
- |
DISCUSSION
There is no consensus on screening methods for NAFLD. Liver biopsy remains the gold standard for diagnosing NAFLD, but its clinical use is limited due to its invasive nature. Magnetic resonance imaging (MRI) and computed to mography (CT) are non-invasive diagnostic methods, but they are cumbersome, expensive and not suitable for screening [16]. Ultrasound is the most commonly used method for diagnosing NAFLD and has been endorsed by Asia-Pacific guidelines, but it is still cumbersome for remote rural areas [17,18], and to some extent ultrasound is subject to the subjective judgement of the operator [19].
LAP is an indicator of lipid excess consisting of WC and TG and may reflect visceral fat accumulation better than traditional adiposity indicators [20]. And visceral fat accumulation is considered an important risk factor for the development of NAFLD [21]. Visceral fat accumulation induces the production of several adipocytokines, such as interleukin-6, lipocalin, resistin and leptin, which increase insulin resistance and trigger macrophage infiltration and inflammatory responses, leading to increased liver inflammation and fibrosis [22]. And high levels of TG can promote the transport of free fatty acids to the liver, triggering the development of NAFLD [23].
Our study found that LAP was significantly higher in the NAFLD population than in the non-NAFLD population, and that LAP was an independent risk factor for the development of NAFLD. The AUC of LAP for predicting the development of NAFLD in the male and female populations were 0.768 and 0.845, respectively; the sensitivity was 71.8% and 80.4%, respectively; the specificity was 69.7% and 77.9%, respectively. A large cross-sectional study showed that the sensitivity of LAP in predicting the risk of NAFLD in Chinese male adults was 77% and the specificity was 75%, and the sensitivity of LAP in predicting the risk of NAFLD in Chinese female adults was 82% and the specificity was 79% [13], which is very close to the results of our study. A study by Zhang et al. compared the efficacy of anthropometric measures such as BMI, WC, waist-to-height ratio (WHtR) and LAP in predicting NAFLD in older adults and showed that LAP was the best marker for predicting NAFLD among these measures [24]. Sheng et al. also showed that LAP predicted incident NAFLD better than WHtR in both men and women, BMI, TG/HDLC, WC, visceral adiposity index (VAI), TG, and especially in young women, LAP predicted NAFLD with an AUC as high as 0.980 [25]. Another study verified this theory pathologically by liver biopsy, and LAP predicted hepatic steatosis and NAFLD better than other common non-invasive biomarkers in the general Chinese population undergoing liver biopsy [26].
Asprosin, a fasting-induced gluconeogenic hormone, was first discovered in 2016, and many studies have shown that asprosin plays a key role in promoting glucose release from the liver and maintaining glucose homeostasis [27,28]. The potential mechanisms underlying the relationship between asprosin and NAFLD were explored in an animal study, which found that increased asprosin could exacerbate hepatocyte dysfunction and lipid aggregation, disrupt lipid metabolic homeostasis, and exacerbate inflammatory responses through ROS-mediated oxidative stress. More importantly, deletion of the asprosin gene attenuated hepatic steatosis and NASH in mice [29]. Another animal study also showed that reducing asprosin activated AMPK signalling, thereby inhibiting lipid accumulation and inflammatory infiltration in the liver [30]. The above two animal studies provide conclusive evidence for the relationship between asprosin and NAFLD, and it can be assumed that asprosin plays an important role in the development of NAFLD, and asprosin may become a new target for the diagnosis and treatment of NAFLD in the future. However, there are fewer studies on the relationship between human asprosin and NAFLD. High levels of asprosin have been reported to be associated with NAFLD in elderly patients with type 2 diabetes mellitus [31], and serum asprosin levels are elevated in children with obesity associated with NAFLD [32]. A previous study by our team also found that serum asprosin levels were independently and positively correlated with the hepatic steatosis indicator, the controlled attenuation parameter (CAP), in an adult population undergoing physical examination [11], suggesting that asprosin may be a predictor of NAFLD. Ke et al. have also suggested that the combination of asprosin and lipofuscin may be a novel biomarker for the diagnosis of NAFLD [8].
In this study, we found that asprosin was an independent risk factor for the development of NAFLD, the AUC of asprosin for predicting the development of NAFLD in male and female populations were 0.771 and 0.791, respectively; the sensitivity was 62.5% and 82.2%, respectively; the specificity was 76.9% and 63.1%, respectively; and the optimal cut-off values were 29.110 and 22.420, respectively. On this basis, our joint analysis of asprosin and LAP showed that the AUC of the two combined to predict incident NAFLD in the male population increased from 0.771, 0.768 to 0.821. The AUC of the two combined to predict incident NAFLD in the female population increased from 0.791, 0.845 to 0.871. And the AUC of the two combined to predict incident NAFLD in the total population increased from 0.781, 0.799 to 0.841. Therefore, the combination of asprosin and LAP may improve the prediction of NAFLD. Therefore, the combination of asprosin and LAP may improve the predictive efficacy of NAFLD and make screening for NAFLD more accurate and effective.
The study also found that asprosin and LAP predicted NAFLD better in women than in men, whether as a single predictor or a combination of the two. This discrepancy can be attributed, at least in part, to the fact that the prevalence, quantity, and proportion of smoking and alcohol consumption are significantly higher in men than in women. These habits have been associated with the development of NAFLD [33,34], suggesting that the risk factors for developing NAFLD are more complex in men. Furthermore, the predominant distribution of body fat in women, characterised by subcutaneous storage, contrasts with the tendency of men to accumulate fat in visceral organs, a phenomenon more closely linked to central obesity [35,36]. In addition, oestrogen has been shown to be an important contributor to energy balance and metabolic homeostasis, protecting women from less damage from metabolic disease [37].
The study’s merits are manifold. Firstly, the selected indicators are simple, easy to measure and low cost, which renders them suitable for large-scale screening. Secondly, the subjects were all drawn from the routine physical examination population, which is more consistent with the overall population background of screening. Furthermore, previous studies have focused on the prediction efficiency of a single indicator for NAFLD. However, this study combined the two indicators to greatly improve the prediction efficiency for NAFLD. However, the study is not without its limitations:Firstly, the study was conducted in a single centre with relatively homogenous race. Given the recognised differences in the characteristics of NAFLD among different racial groups, further verification in diverse ethnic populations is necessary to confirm the generalisability of the findings. Secondly, although the study controlled for multiple potential confounding factors, the possibility of unmeasured confounders cannot be ruled out, such as exercise and diet structure. Finally, the necessity for further prospective studies to evaluate the findings is highlighted, given that this study is a ret rospective cross-sectional study.
CONCLUSION
In conclusion, the present study has demonstrated the efficacy of both asprosin and LAP as predictors of NAFLD. The combined predictive efficacy of the two indicators is superior to that of a single indicator, and the predictive efficacy is more pronounced in females than in males. Consequently, the combination of asprosin and LAP emerges as a promising marker for large-scale NAFLD screening and can serve as an effective indicator for individualised surveillance. This study provides a simple and effective alternative for epidemiological investigations and individualised health management.
FUNDING
This research did not receive any specific grant from funding agencies in the public, commercial, or not-for-profit sectors.
AVAILABILITY OF DATA AND MATERIAL
All data used to support the findings of this study are available on request from the corresponding author.
ACKNOWLEDGMENTS
The authors would like to thank all the reviewers who participated in the review.
How to Cite
References
URL: https://pubmed.ncbi.nlm.nih.gov/33894145/
URL: https://pubmed.ncbi.nlm.nih.gov/26057287/
URL: https://pubmed.ncbi.nlm.nih.gov/30871980/
URL: https://pubmed.ncbi.nlm.nih.gov/27087445/
URL: https://pubmed.ncbi.nlm.nih.gov/32944923/
URL: https://pubmed.ncbi.nlm.nih.gov/34108103/
URL: https://pubmed.ncbi.nlm.nih.gov/33663304/
URL: https://pubmed.ncbi.nlm.nih.gov/32645536/
URL: https://pubmed.ncbi.nlm.nih.gov/36630758/
URL: https://pubmed.ncbi.nlm.nih.gov/37473965/
URL: https://www.nature.com/articles/s41598-024-62124-w
URL: https://pubmed.ncbi.nlm.nih.gov/16150143/
URL: https://pubmed.ncbi.nlm.nih.gov/28775758/
URL: https://pubmed.ncbi.nlm.nih.gov/36922815/
URL: https://pubmed.ncbi.nlm.nih.gov/17894848/
URL: https://pubmed.ncbi.nlm.nih.gov/32610115/
URL: https://pubmed.ncbi.nlm.nih.gov/27441333/
URL: https://pubmed.ncbi.nlm.nih.gov/17565629/
URL: https://pubmed.ncbi.nlm.nih.gov/34461208/
URL: https://pubmed.ncbi.nlm.nih.gov/36183132/
URL: https://pubmed.ncbi.nlm.nih.gov/26226099/
URL: https://pubmed.ncbi.nlm.nih.gov/31467918/
URL: https://pubmed.ncbi.nlm.nih.gov/23929732/
URL: https://pubmed.ncbi.nlm.nih.gov/33574841/
URL: https://pubmed.ncbi.nlm.nih.gov/34706716/
URL: https://pubmed.ncbi.nlm.nih.gov/38456353/
URL: https://pubmed.ncbi.nlm.nih.gov/30037606/
URL: https://pubmed.ncbi.nlm.nih.gov/29106398/
URL: https://pubmed.ncbi.nlm.nih.gov/38798186/
URL: https://pubmed.ncbi.nlm.nih.gov/37647445/
URL: https://pubmed.ncbi.nlm.nih.gov/38438865/
URL: https://pubmed.ncbi.nlm.nih.gov/34370215/
URL: https://pubmed.ncbi.nlm.nih.gov/28189080/
URL: https://pubmed.ncbi.nlm.nih.gov/21771141/
URL: https://pubmed.ncbi.nlm.nih.gov/25365922/
URL: https://pubmed.ncbi.nlm.nih.gov/22262160/
URL: https://pubmed.ncbi.nlm.nih.gov/31754750/