Abstract
Background : Aortic dissection (AD) is a critical cardiovascular condition with increasing incidence and mortality rates. Despite advances in cardiovascular medicine, the management of AD, focusing on stabilizing blood pressure (BP) and heart rate (HR), faces challenges due to the dynamic nature of these parameters. This study aimed to assess the predictive value of blood pressure variability (BPV) and heart rate variability (HRV) on the mortality of AD patients.
Method : This was a retrospective, cross-sectional study conducted at two major hospitals in China, analyzing adult inpatients diagnosed with non-traumatic Type-A and Type-B AD from January 2004 to December 2018. Statistical analyses were performed using logistic regression models and a variety of variability indices (standard deviation, coefficient of variation, average real variability, weighted mean of daytime and nighttime standard deviation, and variation independent of mean).
Results : The study found significant predictive efficacy of BP and HR variability on the mortality of AD patients. Specifically, models incorporating the standard deviation of systolic BP, diastolic BP, and HR variability showed superior predictive performance, with a C-index above 0.86, surpassing previous machine learning models.
Conclusions : BPV and HRV serve as key indicators with the potential to improve management strategies and develop mortality prediction models for AD. Future efforts will focus on integrating these predictive models into clinical practice, particularly through wearable device technology, to enhance dynamic BP and HR monitoring and management in AD patients. Limitations of the study include its retrospective design, modest sample size, and potential selection bias.
Keywords
INTRODUCTION
Aortic dissection (AD) stands out as one of the most devastating conditions among various aortic pathologies, characterized by a notably high death rate. In a stark contrast to the significant progress observed in the majority of cardiovascular conditions, there has been a noticeable upward trend in both the occurrence and in-hospital fatality rates of AD over the last two decades. Specifically, the incidence rate has escalated from 4.4 to 5.3 cases per 100,000 individuals annually between 1995 and 2015[1]. Concurrently, there has been an increase in the mortality rate from 12% to 14% during the years 1995 to 2013 [1,2]. The fundamental management strategy for AD involves stabilizing blood pressure (BP) and heart rate (HR). According to guidelines [3-6], this entails a proactive reduction of patients’ systolic blood pressure (SBP) to between 100 and 120 mmHg and maintaining their HR at around 60 beats per minute, primarily through the administration of intravenous β blockers. The cardiological societies endorse this intensive medical approach for AD, rating it as class I level C—a strong recommendation albeit based on limited evidence [4]. From a practical medical standpoint, we believe that these static thresholds fail to account for the inherently dynamic nature of BP and HR, both of which are critical in triggering cardiovascular events. BP and HR are continuous physiological parameters that provide more information about variations beyond single measurement values. In clinical practice, it’s observed that fatalities among AD patients often occur during unexpected fluctuations in BP triggered by events such as defecation, vomiting, or increased abdominal pressure. Previous studies have explored BP variability in patients with AD [7,8], and our prior research has also attempted to propose indicators of these fluctuations to explain mortality [9,10]. However, no study has systematically observed the applicative value of blood pressure variability (BPV) indicators in patients with AD. To our knowledge, our study is the first to compare a variety of BPV indicators between death and surviving patient groups with AD. Through our analysis, we have identified several BP and HR variability indicators with strong predictive efficacy for AD. Moreover, we have developed a clinically applicable mortality prediction model based on the variability of BP and HR, aiming to assist in clinical practice.
METHODS
Study Design and Population
This investigation was a retrospective, two-site study conducted at the Shanghai Ninth People’s Hospital, affiliated with Shanghai Jiao Tong University School of Medicine, and the Department of Vascular at The First Affiliated Hospital of Anhui Medical University. It was a cross-sectional analysis, encompassing adult inpatients diagnosed with Type-A and Type-B non-traumatic AD from January 2004 to December 2018. The procedures follow the TRIPOD statement [11], and the study protocol is reviewed and approved by the local ethics committee. The need for written patient consent is waived because of the observational nature of this study. This retrospective factorial study was registered with the Chinese Clinical Trial Registry (No. ChiCTR1900025818).
Diagnostic confirmation was through imaging techniques, including contrast-enhanced Computed Tomography Angiography (CTA) and Magnetic Resonance Imaging (MRI). Monitoring of BP and HR was done for Type-A AD and complex Type-B cases in emergency surgery prep and for uncomplicated Type-B AD patients during medical management for up to 14 days or until adverse events. BP and HR readings varied from every 5 minutes to 2 hours, based on patient status, using automated non-invasive BP monitors. Patient data, including demographics, clinical symptoms, medical background, and outcomes, were extracted from electronic medical records. Imaging details, such as aortic measurements and effusions, were sourced from CTA or electronic records. Complicated AD encompassed persistent pain, uncontrolled hypertension, rapid aortic growth, malperfusion, and rupture signs. Observations with SBP under 40 mmHg were excluded to preempt irreversible circulatory imbalances.
Statistical Analyses
The five variability indices for BP and HR include the standard Deviation (SD), coefficient of Variation (CV), average real variability (ARV), weighted mean of daytime and night-time standard deviation (wSD), and variation independent of mean (VIM). Detailed methods for calculating these five variability indices can be found in the appendix.
Chi-square tests were used to compare categorical variables between death and surviving patient groups with AD, and unpaired t-tests were used to compare continuous variables. All p-values are two-tailed and 95% confidence intervals are used. A P<0.05 was considered statistically significant. Firstly, a series of variability indicators of BP and HR are constructed. See supplementary materials for specific formulas. Logistic regression was used to screen meaningful indicators. Then, in order to evaluate the predictive value of blood pressure and heart rate variability on the clinical outcome of AD, we developed a series of logistic regression models based on the basic model (including age, gender, dissection type, Marfan syndrome, complex dissection, admission time, admission symptoms, chronic obstructive pulmonary disease (COPD), hypertension, diabetes, etc.), including different BP and HR variability indicators. Subsequently, areas under receiver operator characteristic (AUROC) curves were used to assess the diagnostic performance of models with different combinations of BP and HR variability indicators in distinguishing AD clinical outcomes. Finally, confidence intervals and p-values for changes in the C statistic between the combined model for different BP and HP variability indicators and the basic model were calculated using the CsChange package and displayed as forest plots. All statistical analyses were performed using with R software (version 4.3.1).
RESULTS
Comparison of Baseline Characteristics, Blood Pressure, and Heart Rate Variability between the Mortality and Control Groups
Patients were categorized into a mortality group (n = 74) and a control group (n = 384) based on in-hospital survival. Comparative characteristics of both groups are presented in Table 1. As observed from Table 1, the mortality group exhibited a higher incidence of Type-A dissection (74.3% vs 27.6%, P < 0.001), a greater prevalence of Marfan syndrome (13.5% vs 3.1%, P < 0.001), a higher rate of complex dissection (31.1% vs 17.2%, P < 0.001), and a higher occurrence of acute dissection. Additionally, the proportion of patients with concomitant aneurysms was significantly greater in the mortality group (47.3% vs 16.4%, P < 0.001). Among initial symptoms at admission, the occurrence of shock was notably higher in the mortality group (8.1% vs 0.5%, P < 0.001), while asymptomatic presentations were less frequent compared to the control group (4.1% vs 10.2%, P < 0.001). The control group had a higher prevalence of hypertension (71.1% vs 56.8%, P = 0.021). There were no significant statistical differences between the two groups regarding gender, age, COPD incidence, diabetes, history of previous dissections, prior heart diseases, or renal insufficiency.
In terms of SBP variability, the mortality group showed higher values in SD (14.7 vs 12.02, p<.001), CV(12.33 vs 9.61, p<.001, and VIM (15.08 vs 11.93, p<.001), compared to the control group, while ARV and wSD showed no statistically significant difference. For diastolic blood pressure (DBP) variability, the mortality group had higher SD (9.71vs 8.28, p<.001), CV (15.27 vs 11.26, p<.001), wSD (9.10 vs 8.19, p<.001), and VIM (10.49 vs 8.20, p<.001), whereas ARV did not differ significantly between the groups. In the comparison of heart rate variability, the mortality group’s SD (10.29 vs 7.14, p<.001), CV (13.06 vs 9.31, p<.001), ARV (5.17 vs 4.37, p<.001), wSD (9.92 vs 7.01, p<.001), and VIM (10.56 vs 7.40, p<.001) were all higher than those in the control group. Details in Table 1.
Table 1: : Characteristics of two groups
|
Mortality group (N=74) |
Control group (N=384) |
p |
|
|
Age(Mean ±SD,years) |
56.09 ± 14.12 |
57.25 ± 13.26 |
.497 |
|
Male(N,%) |
60 (81.1%) |
303 (78.9%) |
.790 |
|
Type-B dissection(N,%) |
19 (25.7%) |
278 (72.4%) |
<.001 |
|
Marfan syndrome(N,%) |
10 (13.5%) |
12 (3.1%) |
<.001 |
|
Complex dissection (N,%) |
23 (31.1%) |
66 (17.2%) |
.009 |
|
Admission time (day) |
0.42 (0.25 to 2.00) |
1.00 (0.33 to 7.00) |
.002 |
|
Admission symptoms |
|||
|
Asymptomatic presentation(N,%) |
3 (4.1%) |
39 (10.2%) |
<.001 |
|
Pain(N,%) |
58 (78.4%) |
314 (81.8%) |
|
|
Shock(N,%) |
6 (8.1%) |
2 (0.5%) |
|
|
Other symptoms(N,%) |
7 (9.5%) |
29 (7.6%) |
|
|
COPD (N,%) |
3 (4.1%) |
26 (6.8%) |
.537 |
|
Hypertension (N,%) |
42 (56.8%) |
273 (71.1%) |
.021 |
|
Diabetes mellitus (N,%) |
2 (2.7%) |
26 (6.8%) |
.283 |
|
History of previous dissections (N, %) |
4 (5.4%) |
20 (5.2%) |
1.000 |
|
History of heart diseases (N,%) |
20 (27%) |
65 (16.9%) |
.060 |
|
Renal insufficiency (N,%) |
3 (4.1%) |
31 (8.1%) |
.334 |
|
Concomitant aneurysm (N,%) |
35 (47.3%) |
63 (16.4%) |
<.001 |
|
SBP [Median(IQR),mm Hg] |
|||
|
SD |
14.70 (10.23 to 20.49) |
12.02 (9.85 to 14.56) |
<.001 |
|
CV |
12.33 (8.91 to 16.75) |
9.61 (8.18 to 11.36) |
<.001 |
|
ARV |
8.77 (7.00 to 11.62) |
8.57 (7.17 to 10.18) |
.332 |
|
wSD |
13.15 (8.81 to 17.92) |
11.82 (9.62 to 14.41) |
.076 |
|
VIM |
15.08 (11.13 to 20.86) |
11.93 (10.01 to 14.07) |
<.001 |
|
DBP [Median(IQR),mm Hg] |
|||
|
SD |
9.71 (7.88 to 13.66) |
8.28 (7.11 to 9.77) |
<.001 |
|
CV |
15.27 (11.17 to 19.87) |
11.26 (9.79 to 13.32) |
<.001 |
|
ARV |
6.45 (5.52 to 8.11) |
6.50 (5.44 to 7.45) |
.327 |
|
wSD |
9.10 (7.43 to 12.74) |
8.19 (7.05 to 9.60) |
<.001 |
|
VIM |
10.49 (8.15 to 13.73) |
8.20 (7.16 to 9.71) |
<.001 |
|
BPVR[Median(IQR)] |
1.46 (1.22 to 1.77) |
1.43 (1.27 to 1.64) |
.811 |
|
Heart rate [Median(IQR),bmp] |
|||
|
SD |
10.29 (7.70 to 15.36) |
7.14 (5.91 to 8.86) |
<.001 |
|
CV |
13.06 (9.13 to 16.74) |
9.31 (7.33 to 11.48) |
<.001 |
|
ARV |
5.17 (4.30 to 6.94) |
4.37 (3.73 to 5.36) |
<.001 |
|
wSD |
9.92 (6.22 to 13.36) |
7.01 (5.80 to 8.65) |
<.001 |
|
VIM |
10.56 (7.22 to 13.78) |
7.40 (5.87 to 9.19) |
<.001 |
COPD: Chronic Obstructive Pulmonary Disease; SBP: systolic blood pressure; IQR: Interquartile range; DBP: diastolic blood pressure; SD:standard deviation; CV: coefficient of variation; ARV: average real variability; wSD: weighted mean of daytime and night-time standard deviation, VIM: variation independent of mean; BPVR: blood pressure variation ratio; bpm: beat per minute.
Assessing the Impact of Blood Pressure and Heart Rate Variability on Mortality
In our analysis, we incorporated control variables for each BP and HR variability measure to calculate the respective impact of these variabilities on mortality. SD, CV, ARV, wSD and VIM of SBP, DBP and HR were significant, except blood pressure variation ratio (BPVR) (p = 0.690), which had no significant effect on mortality. Among the five variability indicators, the odds ratio (OR) value of SBP was slightly lower than DBP, and the OR value of DBP and HR was basically consistent. Therefore, in the subsequent model construction, the five variability indicators of SBP, DBP, and HR were com bined in various cases. Details are presented in Table 2.
Table 2 : Impact of Blood Pressure and Heart Rate Variability on Mortality
|
OR (multivariable) |
p value |
|
|
SBP (mm Hg) |
||
|
SD |
1.15 (1.09-1.22) |
p<.001 |
|
CV |
1.18 (1.10-1.26) |
p<.001 |
|
ARV |
1.14 (1.04-1.24) |
p=.003 |
|
wSD |
1.13 (1.07-1.20) |
p<.001 |
|
VIM |
1.15 (1.09-1.21) |
p<.001 |
|
DBP (mm Hg) |
||
|
SD |
1.32 (1.19-1.47) |
p<.001 |
|
CV |
1.22 (1.13-1.31) |
p<.001 |
|
ARV |
1.20 (1.03-1.40) |
p=.020 |
|
wSD |
1.34 (1.19-1.52) |
p<.001 |
|
VIM |
1.34 (1.20-1.50) |
p<.001 |
|
BPVR |
1.11 (0.67-1.84) |
p=.690 |
|
Heart rate (bpm) |
||
|
SD |
1.29 (1.17-1.41) |
p<.001 |
|
CV |
1.23 (1.14-1.33) |
p<.001 |
|
ARV |
1.42 (1.20-1.69) |
p<.001 |
|
wSD |
1.24 (1.13-1.37) |
p<.001 |
|
VIM |
1.30 (1.18-1.44) |
p<.001 |
OR: odds ratio; SBP: systolic blood pressure; DBP: diastolic blood pressure; SD: standard Deviation; CV: coefficient of variation; ARV: average real variability; wSD: weighted mean of daytime and night-time standard deviation, VIM: variation independent of mean; BPVR: blood pressure variation ratio; bpm: beat per minute
Comparing Predictive Efficacy of Models In corporating Blood Pressure and Heart Rate Variability
In our study, we enhanced the basic logistic prediction model by integrating combinations of different blood pressure and heart rate variability measures to improve the predictive efficacy for mortality. Details were presented in Table 3 and Figure 1.
Table 3: : Predictive efficacy of models incorporating blood pressure and heart rate variability
|
Model |
C-2.5 |
C-INDEX |
C-97.5 |
|
Basic model + SD-SBP + SD- DBP + SD-HR |
0.868 |
0.904 |
0.940 |
|
Basic model + CV- SBP + CV- DBP + CV-HR |
0.868 |
0.904 |
0.940 |
|
Basic model + VIM- SBP + VIM-DBP + VIM-HR |
0.867 |
0.903 |
0.940 |
|
Basic model + SD-HR |
0.851 |
0.890 |
0.929 |
|
Basic model + VIM-HR |
0.844 |
0.885 |
0.927 |
|
Basic model + CV-HR |
0.840 |
0.883 |
0.926 |
|
Basic model + CV- DBP |
0.839 |
0.882 |
0.925 |
|
Basic model + VIM-DBP |
0.838 |
0.881 |
0.924 |
|
Basic model + VIM- SBP |
0.838 |
0.879 |
0.921 |
|
Basic model + CV- SBP |
0.837 |
0.879 |
0.921 |
|
Basic model + SD- SBP |
0.836 |
0.878 |
0.920 |
|
Basic model+SD-DBP |
0.831 |
0.875 |
0.920 |
|
Basic model |
0.778 |
0.832 |
0.886 |
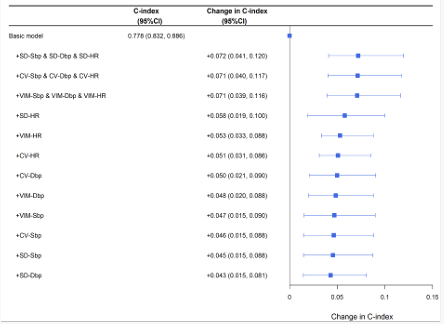
Figure 1: Basic logistic prediction model by integrating combinations of different blood pressure and heart rate variability measures to improve the predictive efficacy for mortality
Given that ARV and wSD demonstrated suboptimal performance in both the variability comparisons and OR analysis, these metrics were not included in our pre dictive model analysis (Supplemental Table 1). The most significant improvement in predictive efficacy was observed in models that concurrently incorporated the SD of SBP, DBP, and HR, yielding a C-index of 0.904. Similar enhancements were noted in models adding the CV of SBP, DBP, and HR (C index of 0.904), as well as those including the VIM for these parameters (C-index of 0.903). Receiver operating characteristic curves of the most significant model and the basic model were presented in Figure 2.
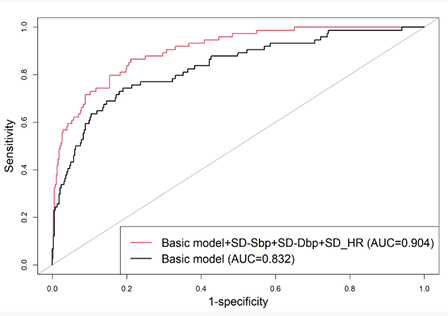
Figure 2: Receiver operating characteristic curves of the most significant model and the basic model
We also tested the inclusion of each individual BP or HR variability measure into the predictive model. The most significant improvement in predictive accuracy was observed when incorporating HR variability measures: adding SD, VIM, and CV of HR achieved C-index values of 0.89, 0.885, and 0.883, respectively. The inclusion of other single BP variability measures resulted in C-index values ranging from 0.875 to 0.882. Details were presented in Table 3.
Additionally, we explored models incorporating two variability measures. The best performer among these was the model adding the SD of SBP and HR, which achieved a C-index of 0.904. The C-index of other dual-measure models ranged from 0.881to 0.902. (Supplemental Table 2).
DISCUSSION
Treating AD remains a challenging aspect in the realm of aortic disease management. On one hand, AD often remains covert until life-threatening symptoms emerge [12,13]. On the other, once the disease manifests, clinical intervention options are limited. For Type-A AD, rapid transfer to a specialist centre for prompt surgery is crucial, alongside stabilizing vital signs and strict control of BP and HR. For Type-B AD, the optimal timing for intervene is during the subacute phase; hence, acute AD patients are managed with strict BP and HR control until the AD enters this phase [14]. During this period, any change in condition necessitates an immediate shift from conservative to emergency surgical treatment. The cornerstone of these treatment strategies is the strict regulation of BP and HR. However, determining how to effectively manage these parameters and what constitutes ideal levels is a common dilemma faced by clinicians treating AD patients.
Our previous research [9], suggests that rapid BP reduction can be as detrimental as rapid increases, significantly impacting patient mortality. Patients experiencing sudden dissection often undergo a series of shocks in a brief period, including excruciating chest pain, constant movement between emergency and ward settings, panic upon being informed of their condition, and the burden of substantial medical costs. Practitioners find it challenging to achieve ideal BP and HR levels in such a short timeframe. Subsequently, side effects of antihypertensive drugs leading to vomiting, patient discomfort due to abdominal pain and bloating, and sleep disturbances caused by monitoring equipment and noise in the ward, all contribute to the difficulty in controlling BP and HR during hospitalization. In this complex clinical frontline scenario, achieving the strict BP and HR control recommended in guidelines is not always feasible. Therefore, we analyzed time-series data of BP and HR, seeking to identify patterns and features influencing mortality in AD patients beyond basic control targets, with the goal of providing more refined conservative treatment plans.refined conservative treatment plans.
In our prior studies [9,10], we developed multiple AD mortality risk prediction models based on dynamic BP and HR data. We also confirmed the impact of BP and HR changes occurring 30 minutes post-admission on mortality. Using intensive care databases (MIMIC-IV), we analyzed the ranges of SBP and DBP associated with the lowest mortality rates, aiming to refine BP targets for AD. This study builds upon our preliminary research, utilizing five common BP and HR variability measures to explore their applicative value in AD patients. Our findings confirm that three variability measures - SD, CV, and VIM - have potential applicative value in these patients. Additionally, we observed that HR variability is a more effective predictor of mortality than SBP and DBP variability. Lastly, we attempted to create several predictive models combining BP, HR variability, and traditional clinical data, aiming to aid clinical practice.
SD, being the most commonly used measure of variability, is straightforward to calculate. The CV, derived from the SD, theoretically reduces the influence of the mean BP, rendering it suitable for scenarios with significant differences in average BP. ARV quantifies the average absolute difference between consecutive measurements, and its strength lies in acknowledging the temporal dynamics of blood pressure fluctuations, thereby offering substantial prognostic value. In this study, the three indicators – SD, CV, and VIM – each exhibit effective predictive capabilities for mortality in patients with Alzheimer’s Disease [15-20].
In our developed logistic prediction models that incorporated BP and HR variability measures, the inclusion of variability indices such as SD, CV, and VIM elevated the C-index to above 0.86. This performance surpasses our prior complex machine learning models that processed BP and HR through sophisticated non-parametric methods, which achieved a Cindex of 0.844. The efficacy of our current predictive models is unquestionably superior. Given their simplicity, the SD and CV algorithms are more feasible for clinical application compared to the computationally intensive and mathematically complex non-parametric methods like the functional data analysis used in our previous studies.
Our future plan involves continuously developing various types of dynamic BP and HR predictive models for AD using retrospective data, followed by validation in prospective cohorts. Thanks to our successful years of in-situ fenestration techniques in endovascular surgeries involving the aortic arch and visceral arteries in AD [21-25], we have become one of the largest AD specialist centers in China. Currently, every AD patient in our research-oriented wards is equipped with a 24-hour wearable device monitoring dynamic BP and HR. Our next step is to integrate these predictive models of AD mortality into the analysis software of these wearable devices and initiate clinical trials for BP and HR control guided by dynamic prediction models. Of course, these efforts necessitate extensive data analysis to identify the most predictive model and repeated validation of risks and benefits of the predictive model in external datasets. The insights on BP and HR variability predictive efficacy provided by this study will be instrumental in achieving this goal.
This study has several limitations that warrant consideration. Firstly, its retrospective nature could introduce inherent biases. Secondly, the sample size was modest, indicating that larger-scale studies might be necessary to corroborate our results. Thirdly, there is potential for selection bias, as critically ill patients might have succumbed before hospital admission. Lastly, BP management was at the discretion of the attending physician, adhering to existing guidelines. Consequently, our dataset does not offer insight into the impact of this variable on patient outcomes.
DATA AVAILABILITY
Data were available from the corresponding authors upon reasonable request.
AUTHOR CONTRIBUTIONS
PQ, XL, XY and RW conceived and designed the study, ZX, XW and QH acquired the data, LF, JQ and KY conducted the analyses, PQ ,LF and XY drafted the manuscript, KY,WL and RW revised it critically for important intellectual content. All authors approved the final version to be published and agreed to be accountable for all aspects of the work.
SOURCES OF FUNDING
This work was supported by these funding as follows: the National Natural Science Foundation of China (82300540, 82170509, 82370494, 82170411), Clinical Research Program of 9th People’s Hospital (JYLJ202010, JYLJ202204), Shanghai Science and Technology Innovation Action Plan (20Y11909600, 21S31904300, 21Y11909500), Shanghai Municipal Health Bureau Project (20224Y0170, 202240145), Fundamental research program of 9th People’s Hospital (JYZZ170), and Original Exploration Project of Shanghai Ninth People’s Hospital (No. JYYC004).
How to Cite
References
URL: https://pubmed.ncbi.nlm.nih.gov/30354376/
URL: https://pubmed.ncbi.nlm.nih.gov/24967167/
URL: https://pubmed.ncbi.nlm.nih.gov/25173340/
URL: https://pubmed.ncbi.nlm.nih.gov/36322642/
URL: https://pubmed.ncbi.nlm.nih.gov/29106452/
URL: https://pubmed.ncbi.nlm.nih.gov/32001058/
URL: https://pubmed.ncbi.nlm.nih.gov/27440162/
URL: https://pubmed.ncbi.nlm.nih.gov/29598863/
URL: https://pubmed.ncbi.nlm.nih.gov/37012019/
URL: https://pubmed.ncbi.nlm.nih.gov/35722130/#:~:text=Conclusions%3A%20This%20study%20classified%20AD,first%2024%20h%20after%20admission.
URL: https://pubmed.ncbi.nlm.nih.gov/25569120/
URL: https://pubmed.ncbi.nlm.nih.gov/36640801/
URL: https://pubmed.ncbi.nlm.nih.gov/31974270/
URL: https://pubmed.ncbi.nlm.nih.gov/34735967/
URL: https://pubmed.ncbi.nlm.nih.gov/31542965/
URL: https://pubmed.ncbi.nlm.nih.gov/38306042/
URL: https://pubmed.ncbi.nlm.nih.gov/38306042/
URL: https://pubmed.ncbi.nlm.nih.gov/36448621/
URL: https://pubmed.ncbi.nlm.nih.gov/28598842/
URL: https://pubmed.ncbi.nlm.nih.gov/24856056/
URL: https://pubmed.ncbi.nlm.nih.gov/33794946/
URL: https://pubmed.ncbi.nlm.nih.gov/33422438/
URL: https://pubmed.ncbi.nlm.nih.gov/33340586/
URL: https://pubmed.ncbi.nlm.nih.gov/31676177/
URL: https://pubmed.ncbi.nlm.nih.gov/28432073/